 Philanthropic support over the past 7 years.
Financial performance 2017
2017 was an outstanding financial year for the Foundation. The US and European stock markets performed extremely well and a weaker Dollar versus the Euro strengthened the result. The Foundation had a net revenue of $1,408,908 or a return of 17% on the assets managed by JP Morgan. 70% of the assets are invested in Equity. The average return per year since inception date is 5,2%.
The operating expenses in 2017 were $43,402 or $12,000 less than in the previous year.
The major part of these expenses relate to fees for managing the US Ruling file and submitting the Form 990-PF to the IRS.
The most important other expenses were E&Y fees for accounting and tax services, salary and travel expenses.
The Grants ‘payable’ in 2017 were $699,622. This amount is based on the commitments for new projects made during the year as required for Dutch reporting purposes.
These projects are: the Rijksmuseum (2017-2019), VUmc (2017) and WNF (2017-18).
The Grants ‘paid’ in 2017 were $747,141 and were well above 5% of the assets which is the requirement for US purposes.
The result was $665,884 positive and helped to increase the Equity from $8,295,299 at end 2016 to $8,961,183 at end 2017.
The Current Liabilities relate to provisions for grants (Rijksmuseum and WNF) and accruals for incurred but unpaid expenses.
Breakdown of grants payable 2017
$
Rijksmuseum 273,250
Stichting VUmc CCA 163,950
WNF 225,000
Exch. Diff. Grants payable 37,422
699,622
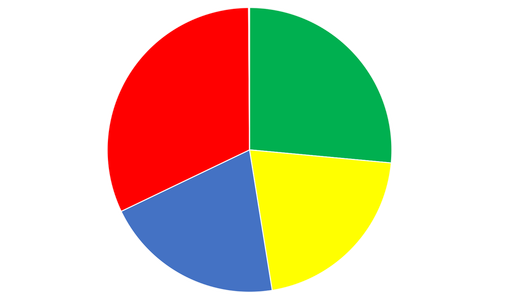
Over the past 7 years, the Bennink Foundation has provided philanthropic support totalling $ 3,022,433
2011: $ 151,133
2012: $ 95,543
2013: $ 718,291
2014: $ 643,373
2015: $ 381,640
2016: $ 332,831
2017: $ 699,622
Safeguarding the planet | Children in Need | The Arts | Medical /Scientific Research | Other |
Balance sheet as at December 31, 2017
Assets 2017 2016
$ $
Fixed assets
Financial fixed assets 9,272,831 8,679,864
Current assets
Cash at bank and in hand 48,314 24,492
Total assets 9,321,145 8,704,356
Equity and liabilities
Equity
General reserves 8,961,183 8,295,299
Long term liabilities 96,172 _
Current liabilities 263,790 409,057
Total equity and liabilities 9,321,145 8,704,356
Statement of Revenue and expenditure for 2017
2017 2016
$ $ $ $
Net revenue securities 1,408,908 211,084
Total net revenue 1,408,908 211,084
Wages and salaries 8,615 7,494
Social security charges 1,541 1,362
Organization and administration
expenses 33,246 46,448
Total operating expenses 43,402 55,304
1,365,506 155,780
Grants payable 699,622 332,831
Excess of rev. over expenditure 665,884 (177,051)
Transparancy and control
The Board approved the 2017 results in their Board Meeting of April 25, 2018.
E &Y Accountants LLP issued on May 2, 2018 their final compilation report on the financial statements 2017 of The Bennink Foundation.
The full Board discusses bills in detail and gives approval. Important decisions, like investing part of the base capital of the Foundation, are taken with approval of at least 75% of the votes.
The Board meets at least twice a year. Additional meetings will be added, as necessary, to follow up on the progress of agreed projects and discuss new proposals.
Accounting policies
The financial statements 2017 have been prepared in accordance with RJK C1. The figures as stated above are adopted from the financial statements 2017. As from 2014 onwards the functional and presentation currency of the Foundation is US Dollar. Commitments for grants are fully expensed in the accounting year in which the decision to commit has taken
by the Board.
2017 was an outstanding financial year for the Foundation. The US and European stock markets performed extremely well and a weaker Dollar versus the Euro strengthened the result. The Foundation had a net revenue of $1,408,908 or a return of 17% on the assets managed by JP Morgan. 70% of the assets are invested in Equity. The average return per year since inception date is 5,2%.
The operating expenses in 2017 were $43,402 or $12,000 less than in the previous year.
The major part of these expenses relate to fees for managing the US Ruling file and submitting the Form 990-PF to the IRS.
The most important other expenses were E&Y fees for accounting and tax services, salary and travel expenses.
The Grants ‘payable’ in 2017 were $699,622. This amount is based on the commitments for new projects made during the year as required for Dutch reporting purposes.
These projects are: the Rijksmuseum (2017-2019), VUmc (2017) and WNF (2017-18).
The Grants ‘paid’ in 2017 were $747,141 and were well above 5% of the assets which is the requirement for US purposes.
The result was $665,884 positive and helped to increase the Equity from $8,295,299 at end 2016 to $8,961,183 at end 2017.
The Current Liabilities relate to provisions for grants (Rijksmuseum and WNF) and accruals for incurred but unpaid expenses.
Breakdown of grants payable 2017
$
Rijksmuseum 273,250
Stichting VUmc CCA 163,950
WNF 225,000
Exch. Diff. Grants payable 37,422
699,622
Over the past 7 years, the Bennink Foundation has provided philanthropic support totalling $ 3,022,433
2011: $ 151,133
2012: $ 95,543
2013: $ 718,291
2014: $ 643,373
2015: $ 381,640
2016: $ 332,831
2017: $ 699,622
Safeguarding the planet | Children in Need | The Arts | Medical /Scientific Research | Other |
Balance sheet as at December 31, 2017
Assets 2017 2016
$ $
Fixed assets
Financial fixed assets 9,272,831 8,679,864
Current assets
Cash at bank and in hand 48,314 24,492
Total assets 9,321,145 8,704,356
Equity and liabilities
Equity
General reserves 8,961,183 8,295,299
Long term liabilities 96,172 _
Current liabilities 263,790 409,057
Total equity and liabilities 9,321,145 8,704,356
Statement of Revenue and expenditure for 2017
2017 2016
$ $ $ $
Net revenue securities 1,408,908 211,084
Total net revenue 1,408,908 211,084
Wages and salaries 8,615 7,494
Social security charges 1,541 1,362
Organization and administration
expenses 33,246 46,448
Total operating expenses 43,402 55,304
1,365,506 155,780
Grants payable 699,622 332,831
Excess of rev. over expenditure 665,884 (177,051)
Transparancy and control
The Board approved the 2017 results in their Board Meeting of April 25, 2018.
E &Y Accountants LLP issued on May 2, 2018 their final compilation report on the financial statements 2017 of The Bennink Foundation.
The full Board discusses bills in detail and gives approval. Important decisions, like investing part of the base capital of the Foundation, are taken with approval of at least 75% of the votes.
The Board meets at least twice a year. Additional meetings will be added, as necessary, to follow up on the progress of agreed projects and discuss new proposals.
Accounting policies
The financial statements 2017 have been prepared in accordance with RJK C1. The figures as stated above are adopted from the financial statements 2017. As from 2014 onwards the functional and presentation currency of the Foundation is US Dollar. Commitments for grants are fully expensed in the accounting year in which the decision to commit has taken
by the Board.